Introduction to water analyses
Overview
In the last session, we learned how to construct a complete case study, focusing on vegetation. In this session, we will look at another vital resource — water. Using the same case study techniques, we will construct a new case study focusing on water. This includes learning to use the Water Observations from Space (WOfS) dataset.
The significance of water
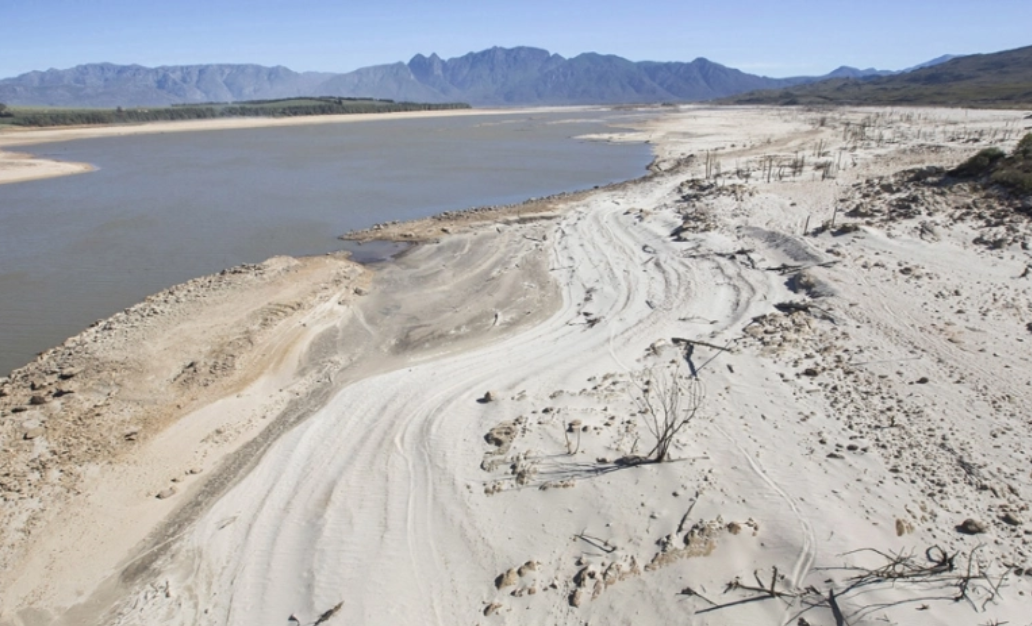
Water is a key concern across the African continent. Many countries are experiencing extreme conditions, such as drought or floods. Water case study analyses can pave the way towards data-driven policy and mitigation strategies. [Image source]
There are many useful analyses that involve water, such as:
Detection of drought
Flood modelling and prediction
Mangrove analysis: mangroves can lessen damage from water surges such as those from storms and tsunamis
Detection of coastal erosion
Reporting for indicators in the United Nations (UN) Sustainable Development Goals (SDGs) that involve water. For example, Goal 6 is about water and sanitation. Some example indicators that the Open Data Cube can facilitate reporting for include:
Indicator 6.3.2: Proportion of bodies of water with good ambient water quality
Indicator 6.6.1: Change in the extent of water-related ecosystems over time
Real world example notebooks
There are several notebooks in the Digital Earth Africa Sandbox that analyse water bodies. These case study notebooks can be found in the Sandbox folder called Real_world_examples.
The Real_world_examples folder contains many case studies; the notebooks related to water are summarised below.
Chlorophyll_monitoring.ipynb
This notebook monitors chlorophyll-a in water bodies using Sentinel-2 data. Chlorophyll-a can indicate the presence of algal blooms, and monitoring this with satellite imagery can provide insights into water quality. The notebook plots the value of the Normalised Difference Chlorophyll Index (NDCI) along with water body area to understand how the presence of clorophyll-a changes with time.
Coastal_erosion.ipynb
This notebook monitors coastal erosion with Landsat 8 data. Using satellites to monitor coastal change over large areas can be a cost-effective method of tracking change and preempting infrastructure needs. This notebook extracts shorelines from composite measures of the Modified Normalised Difference Water Index (MNDWI) and plots how they change from year to year.
Intertidal_elevation.ipynb
This notebook models tides with Landsat 5, 7, and 8 data. By examining the presence of water between low and high tide, the notebook builds up a 3D elevation map of inter-tidal zones such as sandy beaches and rocky shores.
Radar_water_detection.ipynb
This notebook detects water using Sentinel-1 data. Sentinel-1 is a radar satellite, which is unaffected by cloud cover. This allows the detection of water in cloudy conditions, such as during heavy rain events.
Water_extent.ipynb
This notebook determines the extent of water bodies using the WOfS dataset, which is derived from Landsat data. This notebook relates to Sustainable Development Goals around the spatial extent of water systems, such as UN SDG Indicator 6.6.1. This is an important first step in monitoring the change of water systems over time.
The exercise in this session, Session 6, will contain instructions to create a similar notebook.
Note
It is recommended you open these notebooks in the Sandbox, from the folder called Real_world_examples. This will allow you to run the pre-prepared code for yourself. However, they can also be viewed at the Digital Earth Africa notebook repository, which will display a read-only HTML version from GitHub.
Water detection with WOfS
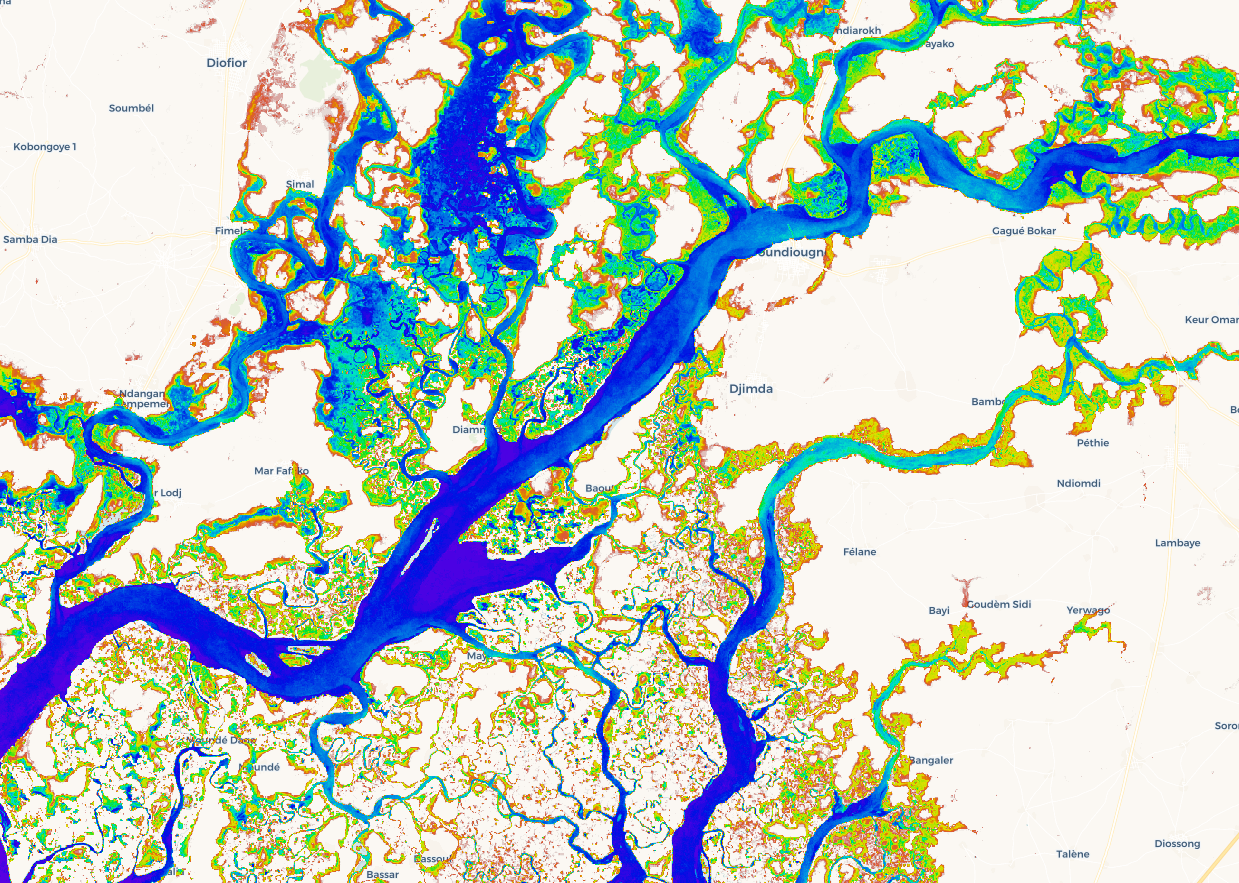
An example of the Water Observations from Space (WOfS) dataset over Senegal.
While we can detect water using band indices, Digital Earth Africa provides the Water Observations from Space (WOfS) dataset. The algorithm that generates this dataset has been trained to detect water in Landsat 8 imagery. You can learn more about WOfS and its algorithm by accessing the Datasets folder on the Sandbox, and double-clicking the Water_Observations_from_Space.ipynb notebook to open it.
There are several WOfS products available through the Digital Earth Africa Sandbox. They can be used for analysis in the same way we have been loading and using Landsat and Sentinel satellite products. We summarise two WOfS products below — feature layers and annual summary.
Feature layers
The base product for WOfS is the feature layers product, ga_ls8c_wofs_2. It has a single measurement called water, which indicates how the algorithm classifies each pixel in the image. water=0 means a dry pixel, and water=128 is a water pixel.
There are a few different classifications for other types of pixels, such as cloud. These are also mapped to unique values.
water=128- Waterwater=64- Cloudwater=0- Dry
Note
Don’t worry if this seems confusing, or you’re not sure how to use this to find water in an image. We’ll cover this during the exercise on the next page. If you want to read more about feature layers, open the Frequently_used_code folder on the Sandbox, then double-click the Applying_WOfS_bitmasking.ipynb notebook to open it.
Annual summary
Digital Earth Africa also has an annual summary WOfS product called ga_ls8c_wofs_2_annual_summary. This product records how often a pixel was classified as water in a given year. This is useful for comparing the presence of water over different years. The WOfS annual summary dataset contains three measurements:
count_wet: The number of times a given pixel was wet during the year.count_clear: The number times a given pixel was clear (not cloudy) during the year. A clear pixel could be either wet or dry.frequency: The ratio ofcount_wettocount_clear, which describes the percentage of time a pixel was wet out of all the times it could be seen during the year.
Conclusion
With a rapidly changing climate, it is incredibly important to be able to understand and analyse water resources. This can easily be done in the Digital Earth Africa Sandbox, which allows access to satellite datasets and products such as WOfS.
In the next section, we will see how to construct a case study investigating water extent using WOfS.