Course conclusion & wrap-up
Congratulations! You have reached the end of the Digital Earth Africa training course.
Over the six sessions, you have learnt how to
Run data analysis notebooks in the Digital Earth Africa Sandbox.
Check data availability for an area of interest using the Digital Earth Africa Maps portal and Metadata Explorer.
Load Earth observation data from a variety of products, including Landsat 8 and Sentinel-2.
Recognise the importance of composite images in providing cloud-free scenes.
Understand band indices and their role in multi-spectral data analysis.
Select a suitable band index for analysis purposes.
Visualise data by plotting maps.
In the Sandbox, you are able to
Set up a notebook with common packages and functions.
Connect to the Open Data Cube to retrieve data.
Load data both with and without cloud masking.
Create geomedian composites.
Calculate band indices such as NDVI.
Construct complete case studies based on vegetation or water indices.
This is a significant achievement. Well done!
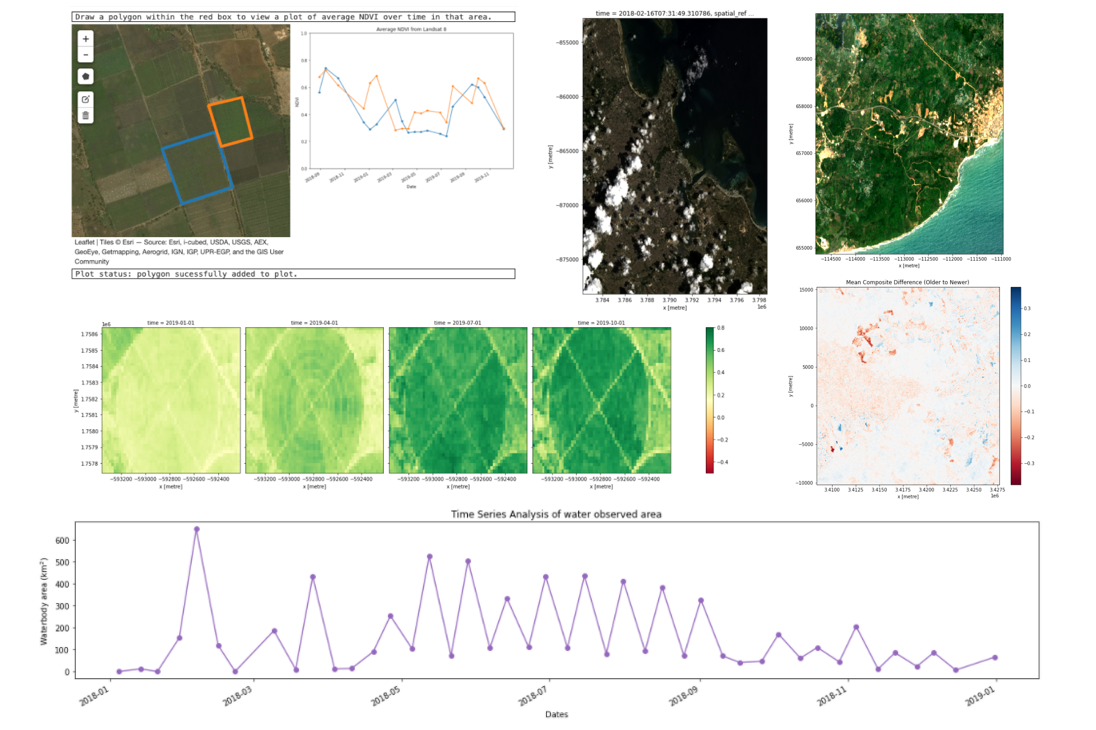
A snapshot of some of the different plots you have created over the course of the six training sessions.
What next?
You now have insight to Digital Earth Africa, and experience with the Sandbox. There are many ways you can take this further. To continue expanding your skills, here are some suggestions on exploring the platform capabilities and functions.
Venturing outside of training material content means there is not always a solutions notebook available. Not to worry — if you run into any trouble or have any questions, you can continue to attend live sessions or contact the course convenors. There are always people ready to help!
1. Complete the training course participant survey
Your feedback, suggestions and ideas are very important to us. Filling in this short survey will provide us with insight to continue refining and developing training material tailored for Digital Earth Africa users.
2. Modify case studies for your area of interest
In Sessions 5 and 6, we built case studies looking at vegetation change with EVI, and water extent over time with Water Observations from Space (WOfS).
Make a copy of those notebooks and change the area of interest. You could investigate:
NDVI or EVI over an area of cropland in your country
Water extent fluctuations over dams or water catchments
You can also try selecting a different index from the calculate_indices function. The full list of available indices can be viewed by accessing the Scripts folder in the Sandbox, and opening deafrica_bandindices.py.
3. Consolidate your Python knowledge using the Python basics and Beginner’s Guide tutorials
During the six sessions, we gradually introduced Python coding concepts with hands-on examples. If you would like to study the theory behind some of the functions and commands we used, have a look at the Extra session: Python basics module, and the Beginners_guide folder in the Sandbox.
The Beginners_guide series of notebooks provide background information, code examples, and a range of applications. Some of this material will be familiar to you, but many of the notebooks contain extra details that can help solidify your understanding of the Sandbox mechanics.
4. Explore real world examples
The case studies we created in Sessions 5 and 6 were based off more complex analyses documented in the Real_world_examples folder of the Sandbox.
These case studies often have a few more data processing steps than the exercises in the training course. After reviewing the Beginner’s Guide contents, these steps should be more accessible and easy to understand.
Use the real world example notebooks to inspire your analysis and improve your data processing technique.
5. Advance your analysis with code snippets
Real world examples are great for generating ideas and providing examples of case study structure. However, when you are writing your own case studies, you may find code snippets in the Frequently_used_code folder even more helpful.
The Frequently_used_code folder contains a series of notebooks demonstrating code doing useful and common functions. This includes plotting boundary or contour lines, exporting files, incorporating external datasets and masking data. They can be easily adapted into your own notebooks.
Keep in contact
Thank you for joining us to explore Digital Earth Africa. We hope you found the training course helpful and informative.
If you have any questions or feedback on the Digital Earth Africa training course, don’t hesitate to contact the course convenors or access the community knowledge bank on Slack.
We are always keen to see what our users have created — feel free to share your results by tagging us on Twitter at #DigitalEarthAfrica.