Session 4 Quiz and Solution
In Session 4, you created a notebook to load satellite products, resample the data into quarterly segments, and then calculate and plot the Normalised Difference Vegetation Index (NDVI). Combining bands into indices such as NDVI can yield important insights into the data which might not be apparent using true-color RGB imagery alone.
Quiz
If you would like to be awarded a certificate of achievement at the end of the course, we ask that you complete the quiz. You will need to supply your email address to progress towards the certificate. After you complete the quiz, you can check if your answers were correct by pressing the View Accuracy button.
The quiz will ask you to use the notebook you developed for this session’s exercise on calculating NDVI. If you would like to confirm that your notebook works as expected, you can check it against the solution notebook provided below.
Note
The solution notebooks below do not contain the answer to the quiz. Use them to check that you implemented the exercises correctly, then use your exercise notebook to answer the quiz. Accessing the solution notebook will not affect your progression towards the certificate.
Solution notebook
Note
We strongly encourage you to attempt the exercise on the previous page before downloading the solution below. This will help you learn how to use the Sandbox independently for your own analyses.
Download the solution notebook for the Session 4 Part 1 exercise
Download the solution notebook for the Session 4 Part 2 exercise
To view a solution notebook on the Sandbox, you will need to first download it to your computer, then upload it to the Sandbox. Follow these instructions:
Download the notebook by clicking the link above.
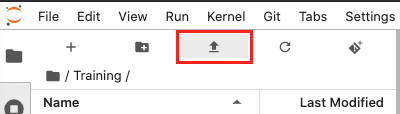
On the Sandbox, open the Training folder.
Click the Upload Files button as shown below.
Select the downloaded notebook using the file browser. Click OK.
The solution notebook will appear in the Training folder. Double-click to open it.