Digital Earth Africa Map
Satellite products, as a dataset, are just a lot of numbers — not the most intuitive format when you are deciding how to analyse the data. It is much more helpful to see what the data looks like. The Digital Earth Africa Map portal helps users visualise Digital Earth Africa products by offering an interactive map.
Overview
In this section, we will show you how to navigate the Digital Earth Africa Map. This includes finding the longitude and latitude coordinates of a location. We will then walk through a short exercise on displaying Landsat 8 data on the Map.
Video: Introduction to the DE Africa Map
This video will show you the basics of the Digital Earth Africa Map portal. In the video, a derived product (called ‘Water Observations from Space’) is loaded.
Watch the video to see the product loading process, then follow the written instructions in the exercise below to load and visualise Landsat 8 data.
Navigate the Digital Earth Africa Map
To access the Map, open https://maps.digitalearth.africa/. This will bring you to the Digital Earth Africa Map user interface.
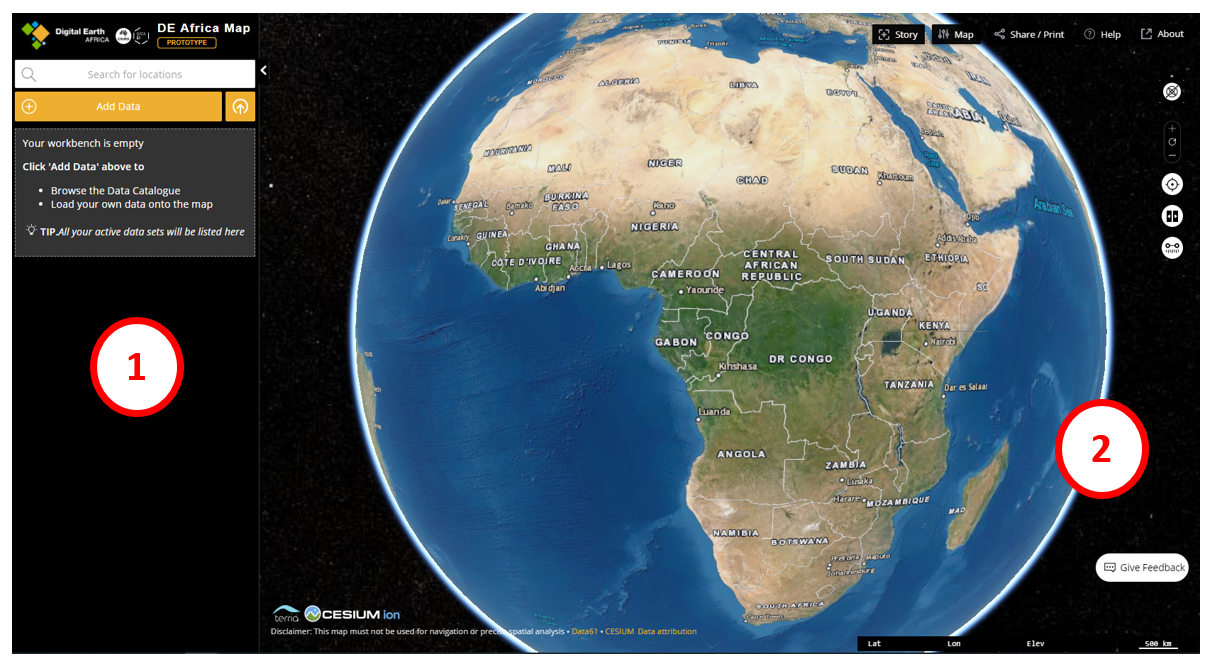
The Digital Earth Africa Map can be split into two sections. The exercise below will cover how to use both.
Data workbench (left side): Allows users to select data they want to view on the Map. By default, no data is selected.
Map interface (right side): Displays the data selected in the workbench, and allows users to customise how the data is viewed. By default, it shows an Esri World Imagery Basemap.
Longitude and latitude coordinates
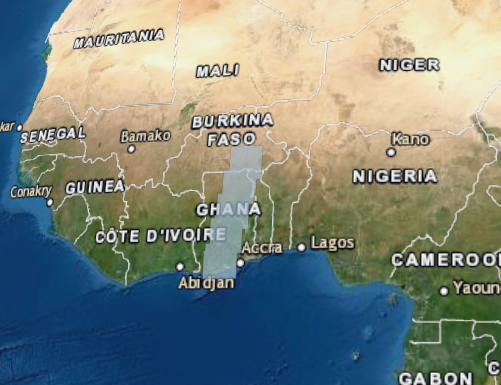
Click anywhere on the map interface to display the longitude and latitude of the selected point.
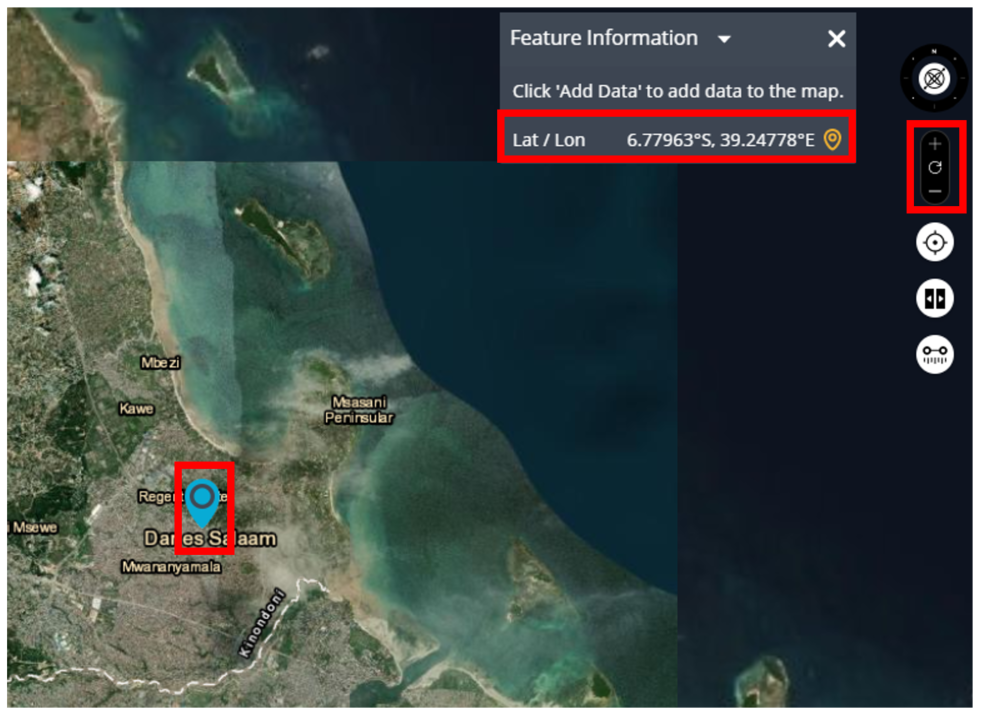
The selected point is shown by a blue location marker.
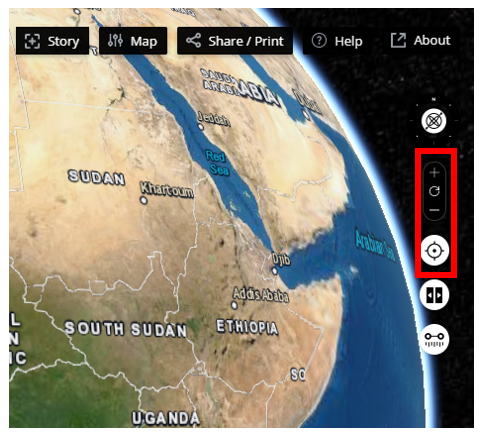
Zoom in to the shaded area by scrolling up on your mouse or pressing the floating + button on the side of the map interface. Left-click and drag to pan the map.
The latitude and longitude coordinates are shown in the Feature Information window. You can highlight and copy them with your mouse.
This function is useful when you want to perform analysis on a certain area, and need to input the longitude and latitude to load the data. We do not need coordinates for the exercise below.
Note
The coordinates from Digital Earth Africa Maps are given in terms of degrees in the cardinal directions (North, East, South, West). Latitude coordinates may be North (N) or South (S). Longititude coordinates may be East (E) or West (W). If copying these values for use in the Sandbox, you must add a negative (-) sign to the latitude value if it is given as South, and you must add a negative (-) sign to the longitude value if it is given as West.
Exercise: Load Landsat 8 imagery
This activity will demonstrate how to load Landsat 8 imagery onto the Digital Earth Africa Map. Follow the instructions below to open the dataset in the workbench and view it in the map interface.
Note
The video above refers to the dataset for Water Observations from Space, however this exercise will use the Landsat 8 dataset.
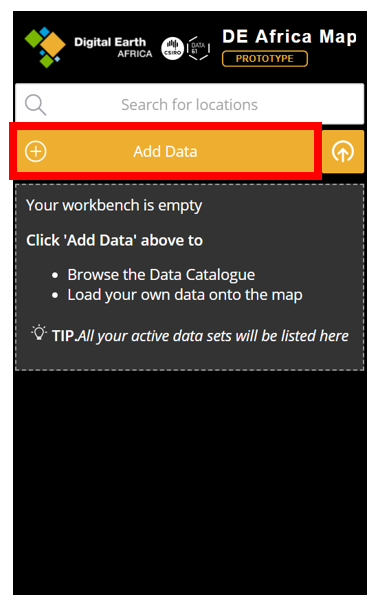
First, we need to select the Landsat 8 dataset. To add data to the data workbench, click Add Data to open the Data Catalogue.
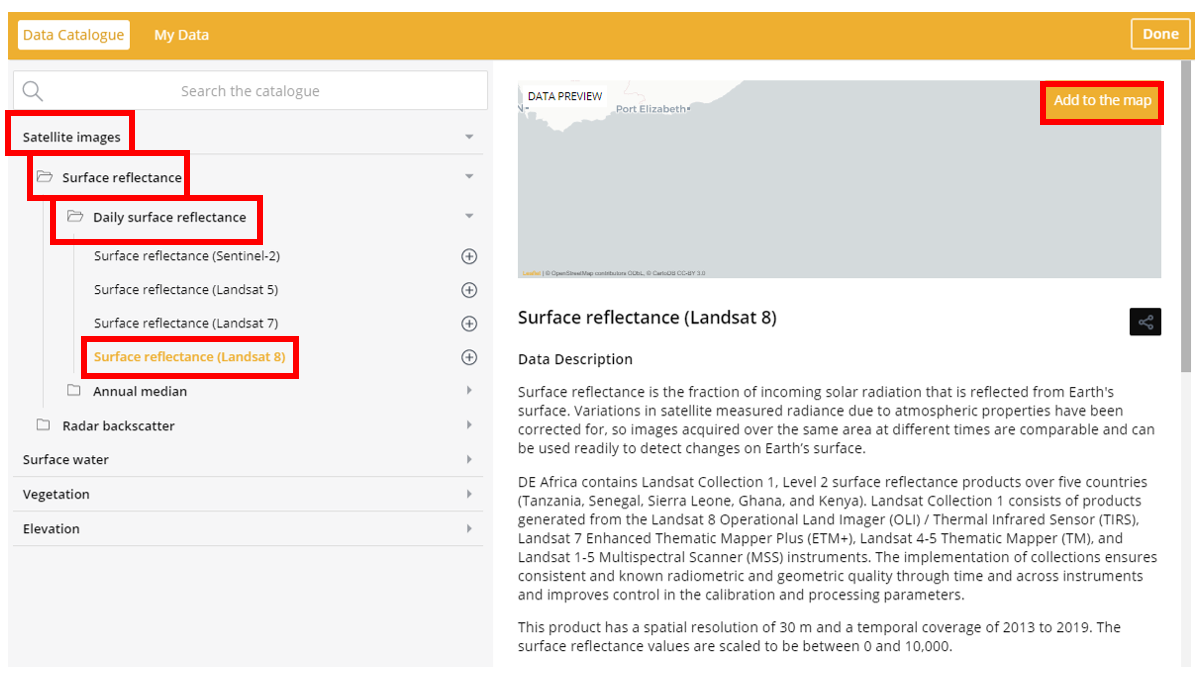
The datasets are organised by category. Landsat 8 is a satellite product, so select Satellite images. Click Surface reflectance and Daily surface reflectance to open the folder of Landsat surface reflectance products. Click Surface reflectance (Landsat 8).
The right panel will show information on the selected dataset. Click Add to the map. This will add the dataset to the workbench and close the Data Catalogue.
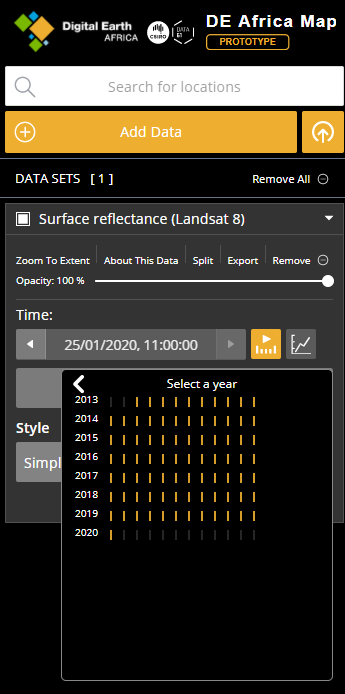
The Landsat 8 data will be displayed in the map interface as blue shaded areas. By default, the data shows the latest available timestep. In this example, this is 25 January 2020.
Zoom in to the shaded area by scrolling up on your mouse or pressing the floating + button on the side of the map interface. Left-click and drag to pan the map.
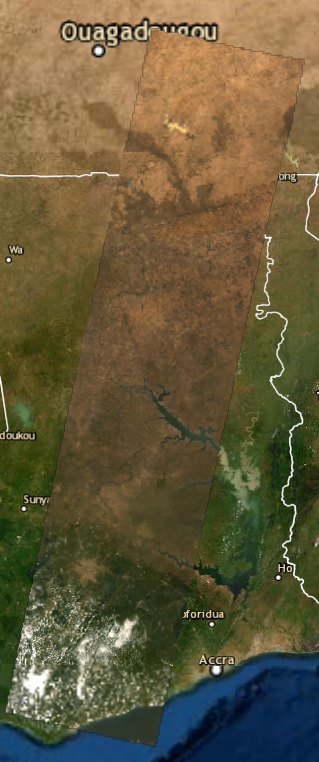
Zooming in on the shaded area will show the Landsat 8 data rendered as true-colour imagery. This is only one day of data, so not all of Africa is covered in the satellite flyover. Only the area inside the rectangle is Landsat 8 imagery.
To see other days of data, click the date shown in the workbench dataset Time bar. This will open a menu that shows all available timesteps for the Landsat 8 product. Select a different time and see how the map shaded area changes.
Congratulations — you have used the Digital Earth Africa Map to view Landsat 8 data.
Optional activity
Now you have successfully loaded Landsat 8 imagery on the Digital Earth Africa Map, try loading imagery for Sentinel-2.
Hints:
The Sentinel-2 product is also a surface reflectance dataset
You can have multiple datasets in the workbench
Other useful functions:
Click on the white square to deselect a dataset. This will keep it in the workbench but remove it from the map interface display
Click on Remove to remove the selected dataset
Click on Remove All to clear all datasets from the workbench
Details on other functions of the Digital Earth Africa Map can be found in the Map portal user guide, but are not necessary to progress in the training course.
Conclusion
Using the Digital Earth Africa Map, we can see the satellite data in a visual way. This makes it easier to understand the scope of the data we are analysing. It is also a useful tool for pinpointing longitude and latitude coordinates of areas of interest.