Building a case study: vegetation analysis
The Crop Health notebook investigated in Session 1 is an example of a case study. We now have enough knowledge of the Sandbox to build a similar comprehensive vegetation analysis.
Overview
In the last session, we calculated the Normalised Difference Vegetation Index (NDVI) as a method of measuring green vegetation over an area of interest.
The index made the Earth observation data easier to analyse, and allowed comparison across time periods. In our NDVI map of a cropping field, we could see there were seasonal variations over the quarterly geomedians. However, that information by itself provides little context for further use. Why are we looking at this field? Do the results fit what we were expecting to see? What can we use this information for?
How you analyse Digital Earth Africa data will depend on what you want to know. Now that we know more about the strengths and limitations of vegetation indices, we can use them to form the basis of a complete case study that informs a user of a real-world outcome.
This session will show you how to extend dataset calculations into a meaningful report. This section outlines some common goals of vegetation analysis, and provides references to examples of case study notebooks. The following sections will walk through a tutorial on how to construct a notebook on vegetation change detection.
The significance of vegetation

Food security is a major focus of the UN’s Sustainable Development Goals (SDGs). The SDGs are a key tenet of the Digital Earth Africa program. [Image source]
Growing things are a cornerstone of life on Earth. Monitoring vegetation can give us insight into:
Agriculture: including cropping, seasonal patterns and changes in land use
Environment health and industry: including forestry, logging and mining
Climate: including desertification and drought
Real world example notebooks
Several case studies based on vegetation indices have already been made using the Digital Earth Africa Sandbox. These case study notebooks can be found in the Sandbox folder called Real_world_examples.
The Real_world_examples folder contains many case studies; the notebooks related to vegetation are summarised below.
Crop_health.ipynb
This notebook draws upon the crop health app function to calculate NDVI for selected fields. By comparing two polygons within the area, it is possible to assess the fields for crop health and productivity over time.
Session 1 used this crop health notebook as an example of Sandbox capability.
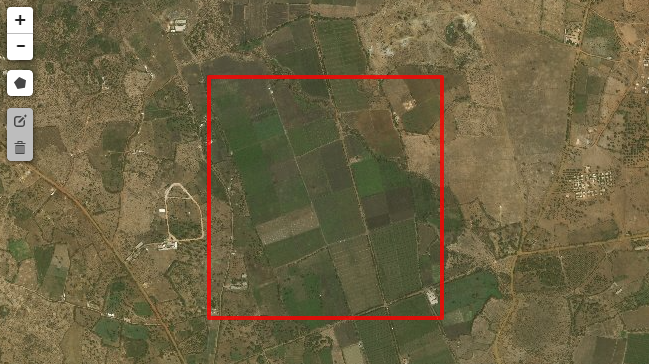
Vegetation_change_detection.ipynb
This notebook visualises vegetation change over time. Areas where vegetation has increased compared to a baseline time are marked in blue, while areas where vegetation has decreased are output as red. This change is indexed using either NDVI, or the Enhanced Vegetation Index (EVI). The notebook allows the user to choose which index is being used.
The exercise in this session, Session 5, will contain instructions to create a similar notebook.
Note
It is recommended you open these notebooks in the Sandbox, from the folder called Real_world_examples. This will allow you to run the pre-prepared code for yourself. However, they can also be viewed at the Digital Earth Africa notebook repository, which will display a read-only HTML version from GitHub.
Structuring a case study
If you opened up some of the real world example notebooks, you might notice they are more complicated than the exercises in this training course. However, they all have the same structure.
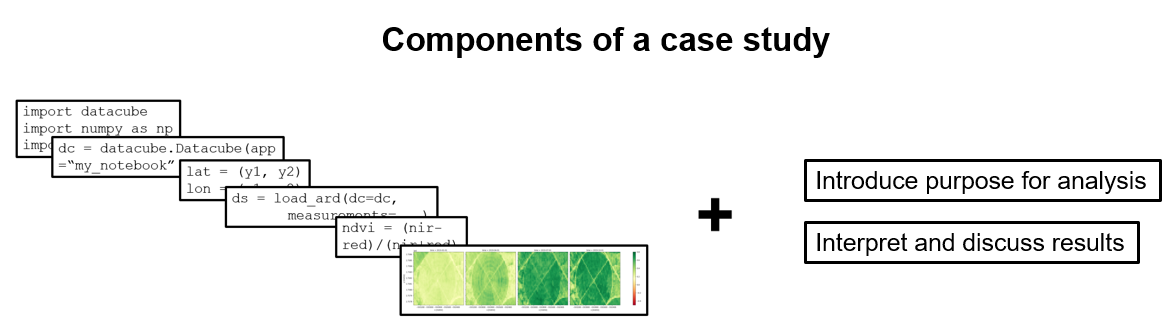
Each notebook you have made from the training course exercises, as well as each real world example notebook, consist of six fundamental components.
Load packages and functions
Connect to the datacube
Define the area of interest using longitude and latitude
Load data from the datacube
Perform analysis or calculation on the data (such as calculating an index)
Plot the results
The Real_world_examples notebooks go a few steps further:
Frame the analysis in the context of a question or purpose — this is normally introduced at the start of the notebook
Extend results analysis and discussion
Conclusion
With some understanding of the context behind spatial data analysis, we are now ready to create our own case study notebook. This week’s exercise is about incorporating the additional two steps (analysis purpose, and additional results discussion) to make a well-rounded case study.