Exercise solutions
This section contains possible solutions to the exercises posed in the Python basics module. There is more than one correct solution for most of the exercises so these answers are for reference only.
Download the exercise solutions notebook
To view the solutions as an interactive notebook, download the file to your machine and upload it to the Sandbox as in the Python basics lessons.
Python basics 1
1.1 Fill the asterisk line with your name and run the cell.
[1]:
# Fill the ****** space with your name and run the cell.

message = "My name is Python"

message
[1]:
'My name is Python'
Python basics 2
[4]:
import numpy as np
2.1 Use the numpy add function to add the values 34 and 29 in the cell below.
[5]:
# Use numpy add to add 34 and 29

np.add(34,29)
[5]:
63
2.2 Declare a new array with contents [5,4,3,2,1] and slice it to select the last 3 items.
[6]:
# Substitute the ? symbols by the correct expressions and values

# Declare the array

arr = np.array([5, 4, 3, 2, 1])

# Slice array for the last 3 items only

arr[-3:]
[6]:
array([3, 2, 1])
2.3: Select all the elements in the array below excluding the last one, [15].
[7]:
arr = np.array([0,1,2,3,4,5,6,7,8,9,10,11,12,13,14,15])

# Substitute the ? symbols by the correct expressions and values

arr[:-1]
[7]:
array([ 0, 1, 2, 3, 4, 5, 6, 7, 8, 9, 10, 11, 12, 13, 14])
2.4 Use arr as defined in 2.3. Exclude the last element from the list, but now only select every 3rd element. Remember the third index indicates stride, if used.
Hint: The result should be
[0,3,6,9,12].
[8]:
# Substitute the ? symbols by the correct expressions and values

arr[:-1:3]
[8]:
array([ 0, 3, 6, 9, 12])
2.5 You’ll need to combine array comparisons and logical operators to solve this one. Find out the values in the following array that are greater than 3 AND less than 7. The output should be a boolean array.
Hint: If you are stuck, reread the section on boolean arrays.
[9]:
arr = np.array([1, 3, 5, 1, 6, 3, 1, 5, 7, 1])

# Use array comparisons (<, >, etc.) and logical operators (*, +) to find where
# the values are greater than 3 and less than 7.

boolean_array = (arr > 3)*(arr < 7)
[10]:
boolean_array
[10]:
array([False, False,  True, False,  True, False, False,  True, False,
       False])
2.6 Use your boolean array from 2.5 to mask the False values from arr.
Hint: The result should be
[5, 6, 5].
[11]:
# Use your resulting boolean_array array from 2.5
# to mask arr as defined in 2.5

arr[boolean_array]
[11]:
array([5, 6, 5])
Python basics 3
[12]:
%matplotlib inline

import numpy as np
from matplotlib import pyplot as plt

im = np.copy(plt.imread('Guinea_Bissau.JPG'))
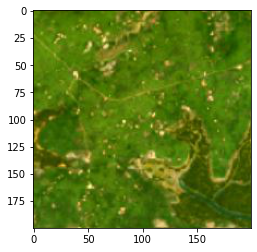
3.1 Let’s use the indexing functionality of numpy to select a portion of this image. Select the top-right corner of this image with shape (200,200).
Hint: Remember there are three dimensions in this image. Colons separate spans, and commas separate dimensions.
[13]:
# Both options below are correct

topright = im[:200, -200:, ]

topright = im[:200, 400:600, ]

# Plot your result using imshow

plt.imshow(topright)
[13]:
<matplotlib.image.AxesImage at 0x7f08e28f7940>
3.2 Let’s have a look at one of the pixels in this image. We choose the top-left corner with position (0,0) and show the values of its RGB channels.
[14]:
# Run this cell to see the colour channel values

im[0,0]
[14]:
array([249, 196, 104], dtype=uint8)
The first value corresponds to the red component, the second to the green and the third to the blue. uint8 can contain values in the range [0-255] so the pixel has a lot of red, some green, and not much blue. This pixel is a orange-yellow sandy colour.
Now let’s modify the image.
What happens if we set all the values representing the blue channel to the maximum value?
[15]:
# Run this cell to set all blue channel values to 255
# We first make a copy to avoid modifying the original image

im2 = np.copy(im)

im2[:,:,2] = 255

plt.imshow(im2)
[15]:
<matplotlib.image.AxesImage at 0x7f08e23d0ac8>
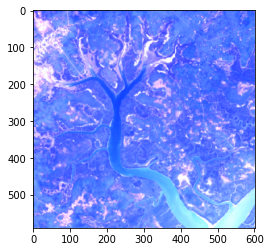
The index notation
[:,:,2]is selecting pixels at all heights and all widths, but only the 3rd colour channel.
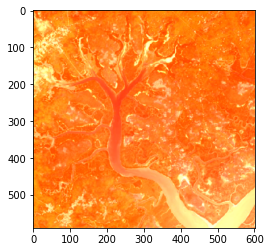
Can you modify the above code cell to set all red values to the maximum value of 255?
[16]:
im2 = np.copy(im)

im2[:,:,0] = 255

plt.imshow(im2)
[16]:
<matplotlib.image.AxesImage at 0x7f08e0b34ef0>
Python basics 4
[17]:
%matplotlib inline

import numpy as np
from matplotlib import pyplot as plt
from matplotlib import colors

# grass = 1
area = np.ones((100,100))
# crops = 2
area[10:60,20:50] = 2
# city = 3
area[70:90,60:80] = 3
index = {1: 'green', 2: 'yellow', 3: 'grey'}
cmap = colors.ListedColormap(index.values())
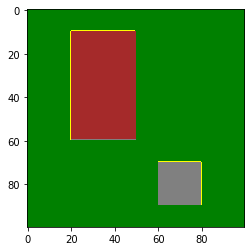
4.1 The harvesting season has arrived and our cropping lands have changed colour to brown. Can you:
4.1.1 Modify the yellow area to contain the new value 4?
4.1.2 Add a new entry to the index dictionary mapping number 4 to the value brown.
4.1.3 Plot the area.
[18]:
# 4.1.1 Modify the yellow area to hold the value 4
area[10:60,20:50] = 4
[19]:
# 4.1.2 Add a new key-value pair to index that maps 4 to 'brown'
index[4] = 'brown'
[20]:
# 4.1.3 Copy the cmap definition and re-run it to add the new colour
cmap = colors.ListedColormap(index.values())
# Plot the area
plt.imshow(area, cmap=cmap)
[20]:
<matplotlib.image.AxesImage at 0x7f08e0b26198>
Hint: If you want to plot the new area, you have to redefine
cmapso the new value is assigned a colour in the colour map. Copy and paste thecmap = ...line from the original plot.
4.2 Set area[20:40, 80:95] = np.nan. Plot the area now.
[21]:
# Set the nan area
area[20:40, 80:95] = np.nan
[22]:
# Plot the entire area
plt.imshow(area, cmap=cmap)
[22]:
<matplotlib.image.AxesImage at 0x7f08e0a78e48>
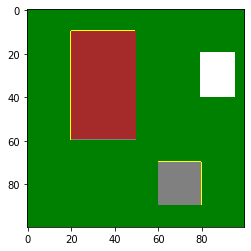
4.3 Find the median of the area array from 4.2 using np.nanmedian. Does this match your visual interpretation? How does this compare to using np.median?
[23]:
# Use np.nanmedian to find the median of the area
np.nanmedian(area)
[23]:
1.0
[24]:
np.median(area)
[24]:
nan
np.median returns a value of nan because it cannot interpret no-data pixels. np.nanmedian excludes NaN values, so it returns a value of 1 which indicates grass. This matches the plot of area.
Python basics 5
[25]:
%matplotlib inline

import numpy as np
from matplotlib import pyplot as plt
import xarray as xr
guinea_bissau = xr.open_dataset('guinea_bissau.nc')
5.1 Can you access to the crs value in the attributes of the guinea_bissau xarray.Dataset?
Hint: You can call upon
attributesin the same way you would select avariableorcoordinate.
[26]:
# Replace the ? with the attribute name

guinea_bissau.crs
[26]:
'EPSG:32628'
5.2 Select the region of the blue variable delimited by these coordinates:
latitude of range [1335000, 1329030]
longitude of range [389520, 395490]
Hint: Do we want to use
sel()orisel()? Which coordinate isxand which isy?
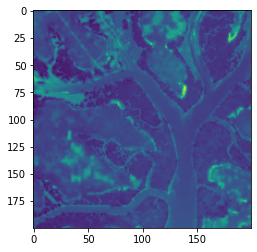
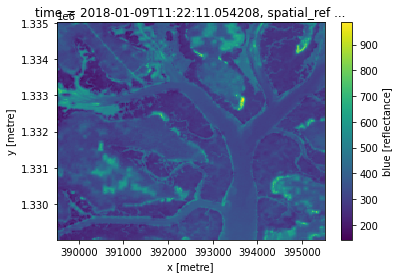
5.3 Plot the selected region using imshow, then plot the region using .plot().
[27]:
# Plot using plt.imshow
plt.imshow(guinea_bissau.blue.sel(x=slice(389520, 395490), y=slice(1335000, 1329030)))
[27]:
<matplotlib.image.AxesImage at 0x7f08cb8f0da0>
[28]:
# Plot using .plot()
guinea_bissau.blue.sel(x=slice(389520, 395490), y=slice(1335000, 1329030)).plot()
[28]:
<matplotlib.collections.QuadMesh at 0x7f08cb824898>
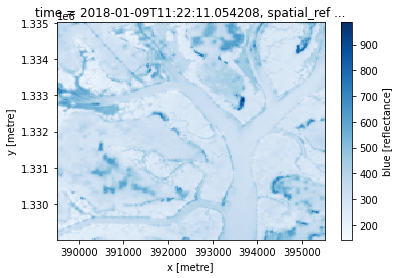
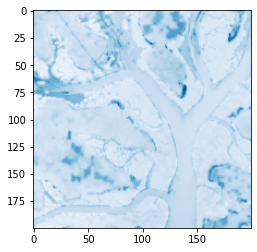
Can you change the colour map to 'Blues'?
[29]:
plt.imshow(guinea_bissau.blue.sel(x=slice(389520, 395490), y=slice(1335000, 1329030)), cmap='Blues')
[29]:
<matplotlib.image.AxesImage at 0x7f08cb763eb8>
[30]:
guinea_bissau.blue.sel(x=slice(389520, 395490), y=slice(1335000, 1329030)).plot(cmap='Blues')
[30]:
<matplotlib.collections.QuadMesh at 0x7f08cb6d1710>